Power BI and Earned Value Management: Why We Need to Be Power BI and EVM Gurus
Today’s Earned Value Management (EVM) world features some rather old-school-looking software, Excel spreadsheets, and charts that all could use a face-lift. Weaving data from spreadsheets into cohesive narratives is a day-to-day part of EVM, but it wasn’t always this way.
EVM originated before spreadsheets existed and long before Excel became an essential tool for ad hoc analysis and reporting. Today, Microsoft’s Power BI (Business Intelligence) is rare in EVM but is evolving into the next essential tool. As more EVM teams realize the benefits of Power BI in project management, this tool and the skills required to use it are quickly becoming requirements.
In this article, we explore the exciting benefits, advantages, and strategies of Power BI, so that EVM teams can overcome long-standing industry challenges. Let’s dive in!
What Is Power BI and What Makes It an EVM Super Tool?
As EVM professionals, we are constantly asked to extract insights from our project data. The problem with constant analysis, however, is that it typically overlooks actionability. EVM professionals regularly find themselves tracking numerous metrics, while also wondering, “What do we do with these? How do they help us make the right calls? What are the prioritized actions to take given this data?”
Power BI is an analysis super-tool that leverages data to provide credible, reliable, and actionable insights. It allows teams to break through the fog of confusion and focus on what matters most. With Power BI, we can transform deep, granular EVM data analysis into quick-and-easy-to-understand summaries. This allows us to grasp key insights instantaneously.
Power BI is a little like ChatGPT for data analytics. Its key strength is its ability to transform data quickly into executive-level summaries, while at the same time allowing users to zoom to whatever level of detail they need.
Why Power BI?
What makes Power BI so powerful? Here are some of its most exciting aspects:
Unleash the storyteller.
We’ve all seen the text-heavy PowerPoints and spreadsheet eye charts. And we’ve all seen what a presentation like that is like — it’s brutal. EV data can be dry, and the story we are trying to tell isn’t always clear. Power BI is a tool to help tell your story.
But Power BI is far more than pretty charts: it’s interactive and allows us to drill down from the visuals directly into our data. Project teams can use interactive dashboards and cool, colorful charts to tell a story. It is through this process that we uncover a narrative that wouldn’t have been obvious otherwise. Analysts can get rich perspective from new vantage points provided by Power BI.
Train Power BI with EVM data and trends.
Power BI goes beyond compelling stories, streamlining decision-making, and creating colorful visuals. We can even train Power BI to use the unique terminology of our teams and industry. This way, stakeholders, decision-makers, and team members can make meaningful connections with the story behind the data.
Customize unique EVM tools inside Power BI.
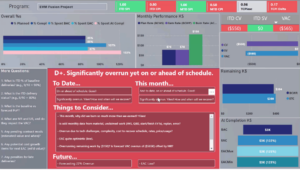
EVM teams commonly develop proprietary Excel spreadsheet models. Power BI allows teams to develop and customize tools unique to EVM use cases. AzTech has built several such tools, including our latest, the Visually Intelligent Performance Report, or VIPR.
VIPR is all about the quick assessment. Are you over or underrun? Are you on time or late? Flip through your project portfolio to see color-coded scores of your various projects, ranging from A+ to F-. By accounting for several factors such as performance and compliance metrics, VIPR instantly scores each project (or each Control Account, or any major chunk of work within a project). VIPR deciphers the data and provides statements, questions, and actions about the performance data and any anomalies to help project teams get insights quick. By providing immediate, simple feedback, the underlying narrative is revealed allowing a higher level of decision-making.
Power BI keeps data secure.
Unlike some cloud-only platforms, Power BI allows teams to download a desktop version, so their data is completely secure. Think of this platform as the ChatGPT of data analytics — but unlike ChatGPT, when we feed our data into Power BI, it is never exposed to others. With Power BI, teams can fully protect the confidentiality of all project information.
It’s simple and free.
In an environment where EVM professionals are constantly needing to learn new tools, Power BI is a breath of fresh air. Compared to some other difficult-to-use analytics platforms, Power BI is quick to set up, and the basics are easy to learn. Teams can interact with Power BI using an elegant User Interface (UI), natural language, and need no special training to leverage its sophisticated features.
Power BI does the heavy lifting so teams can spend less time on building charts and more time on analysis, penetrating insights, decision-making, and mitigation steps. This speeds up the entire process so teams can get important work done.
Here’s a screenshot of Power BI’s quick and easy-to-use drag-and-drop interface:
Last but not least, Power BI is free! The free desktop version is powerful enough for most teams. Just download it and start using it.
How to Get the Most Out of Power BI
To get the most out of Power BI, we suggest teams draw on or develop their soft skills. The tips below may seem simple on the surface, but they can dramatically improve results.
Ask the right questions.
First things first, it’s vital to identify the key questions that we want answered. Before diving into the data, ask management and others on the team: What do we want to know? With the right questions, we have a precise target that drives the way we configure, set up, and use Power BI.
Understand your audience.
Be clear about who the audience will be. The audience determines which graphs and visualizations to use. It also determines what kind of language will have the greatest impact. The data will be far more persuasive by going into a project with the audience in mind.
Sketch first, build later.
Remember to sketch out the minimum data tables you need and play with different dashboards, reports, and graphs. These are valuable for engaging with stakeholders and team members to further develop concepts and ensure everyone is on the same page. Also, when we write things down and sketch things out, it can help us think through our plans and produce better ideas.
Here’s an example of a sketch we created before setting up our VIPR tool on Power BI for a client. Notice how we weren’t concerned about an elegant drawing or a beautiful PowerPoint presentation. Have fun.

Start small.
Once teams are ready to begin, it’s important to start small. Ease into Power BI for Earned Value Management with simple projects first. Don’t try to make the ultimate dashboard right out of the gate. Go for the low-hanging Power BI fruit. Then, after gaining experience, cultivate these efforts into a more nuanced strategy. Trust us. Everything works better that way.
Don’t be afraid to tinker.
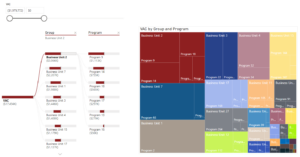
At the data analysis stage, the process of building reports and interacting with charts allows us to see new relationships that weren’t initially obvious. Power BI allows us to do this quickly. At the report-making stage, it’s not uncommon to uncover new, valuable insights — simply by experimenting.
Here’s an example of the kinds of decomposition charts that Power BI allows us to easily create and experiment with:
Prepare for rejection.
Power BI opens the door to visualizing data in new and unexpected ways. As a result, it’s not uncommon for others to question a specific chart or approach the first time they see a presentation. It may take several tries, a few trips back to the virtual or real whiteboard, and some advocating for the approach before it’s accepted. In this respect, teams should be ready to defend their ideas and adjust as needed.
Prepare for surprises.
We’ve all been using traditional EVM tools and Excel models for years and tend to know exactly what kinds of insights to expect from different types of analyses. Power BI opens a new world of insights and possibilities. It’s common to find new correlations that were previously invisible. It’s also an exciting way to visualize data. Teams will be both surprised and delighted. Power BI helps us uncover narratives and convey stories with greater clarity than ever before!
Final Thoughts
Power BI is a revolutionary tool that helps EVM teams quickly answer key questions about their data in beautiful, interactive, and impactful ways. Essentially, Power BI with EVM empowers us to tell better stories that equip audiences to make higher quality decisions.
Because Power BI can radically enhance data analysis capabilities, save time, and unlock new possibilities for visualizing and storytelling, it’s likely to become an indispensable component of every EVM professional’s toolkit.
Want to level up your EVM strategy? Send us an email and let’s talk shop.


Subscribe to our Newsletter: