ACE
“I want to fit performance and compliance on one page. I want a pyramid that moves and dances.”
That was the design challenge put to our AzTech Magic (Developers) team before we designed and developed the AzTech Compliance Expert (ACE).
And so the ACE pyramid was born. A new way to visualize project data in a single, clickable visual.
A way to show Earned Value compliance for the visual and the analytical:
- Benchmark. Normalized project scores where 1000 points is flawless.
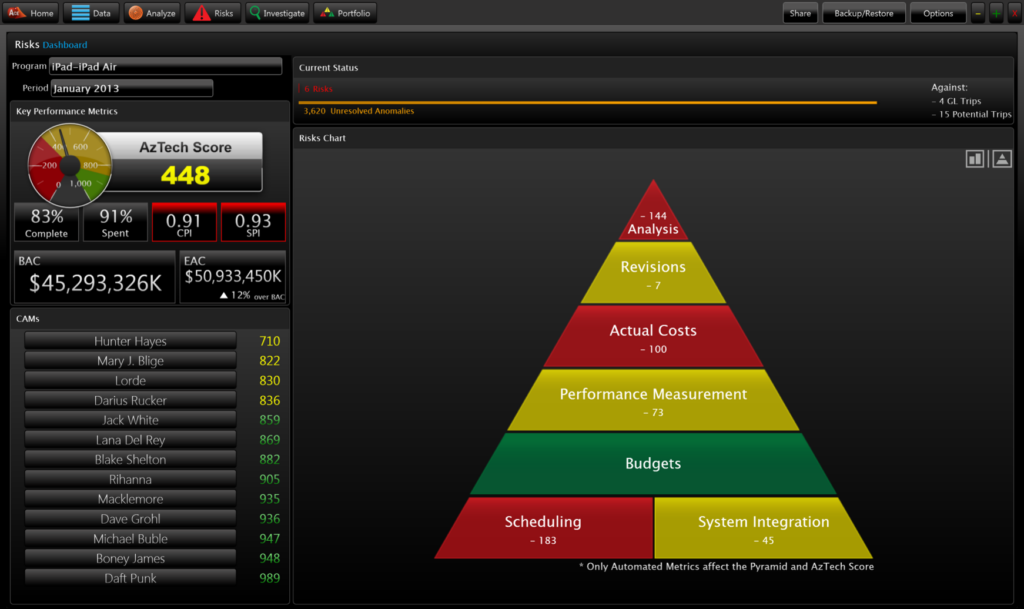
- Showstoppers. Number of 32 EV Guideline trips. These are likely big compliance issues.
- Priority. Fix issues from the base of the pyramid up.
- Focus. Worst to best (red, yellow, green).
- Magnitude. Points deducted in each pyramid slice.
- Risks. Number of EV Guidelines at risk. Potential compliance issues.
- Issues. Number of data anomalies.
- Demo
Take 5 minutes to see how ACE’s 5 key modules can help you take the surprise and panic out of EVMS audits by quantifying and prioritizing Earned Value compliance and surveillance risks. With ACE, you can help turn troubled red projects to high performing green–or even blue projects.
- Benefits
- Simple. Become an EV expert with ACE’s unique project scoring system. Easily compare one project to another and watch compliance risks go down.
- Visual. The ACE compliance risks pyramid provides a unique visual for clicking your way through a project by prioritized groups of metrics all the way down to the task level
- Focus. ACE calculates the magnitude of the data issues by metric and helps data anomalies pop to focus the team on the right problems in the right order.
- Features
Let’s walk through ACE’s 5 key modules to see how ACE can help your project team.
- Portfolio. The PM or Surveillance Manager’s eye in the sky. View Risks and Anomalies for the entire Enterprise, a Business Group, a Program, and by Control Account Manager (Team Leads).
- Risks. The clickable ACE pyramid to drill down from the project to the CAM and on down to the data culprits at the Control Account, Work Package, Planning Package, and Task level.
- Investigate. Use our built-in root cause library to determine if a metric trip is compliant or non-compliant.
- Trending. Choose metrics to plot against each other and uncover correlations between metrics.
- Analyze. Pull the switches or options for each project and save those settings. Great if you work with multiple prime and major subcontractors and different project types.
- Data. Import Cost and Schedule data from two simple Excel tables to run hundreds of metrics in minutes.
- Metrics
ACE automatically groups and prioritizes metrics results to clearly see what needs your attention. Using simplified visuals and an intuitively designed interface, you can easily drill-down and execute a root cause analysis.
Integration Metrics: Fix these culprits first to see overall metrics rapidly improve.
Schedule Metrics: Fix these rascals next because a sound schedule is foundational to great EVM and drives Earned Value (BCWP = Performance) and other EV data. Put your project schedule through a battery of tests. Great before running a Schedule Risk Assessment (SRA), for an Integrated Baseline Review (IBR), and to get audit-ready for Internal, External, or Joint Surveillance Reviews (ISRs / JSRs).
Earned Value (Cost) Metrics: These varmints impact your cost and schedule variances. Test your data validity at all levels: Control Account, Work Package, Planning Package, and Element of Cost.
Automated
Earned Value / Cost
Schedule